Dashboarding
Dashboard & Reports with Data Studio
00.-
Description
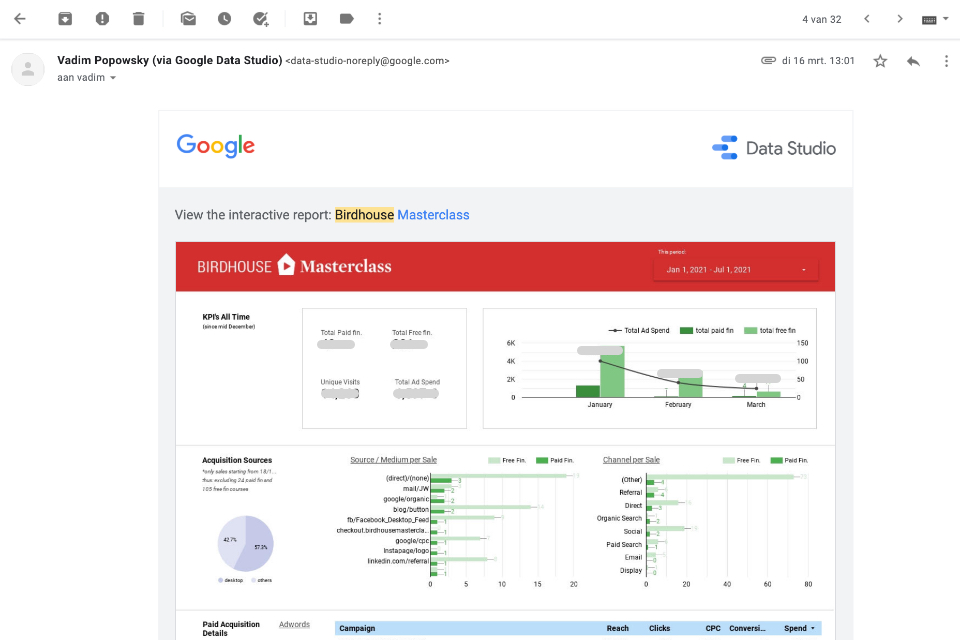
A client of an agency I worked for, asked for a dashboard to track all online advertisement spending, in relation to leads and conversions generated.
01.-
Approach
Google Data Studio + ReportDash
Pick the best tools for our requirements
When the dashboard required is not too complex, we can use Data Studio. Else, a custom Google Sheets could do the trick. It depends largely on the data sources we need, in this case:
conversions:
- Google Analytics visitors and conversions
- sales figures from Thinkific, an online course builder that Birdhouse is using
acquisition:
- email campaigns from Mailchimp
- Facebook ads
- LinkedIn ads
- Google Adwords
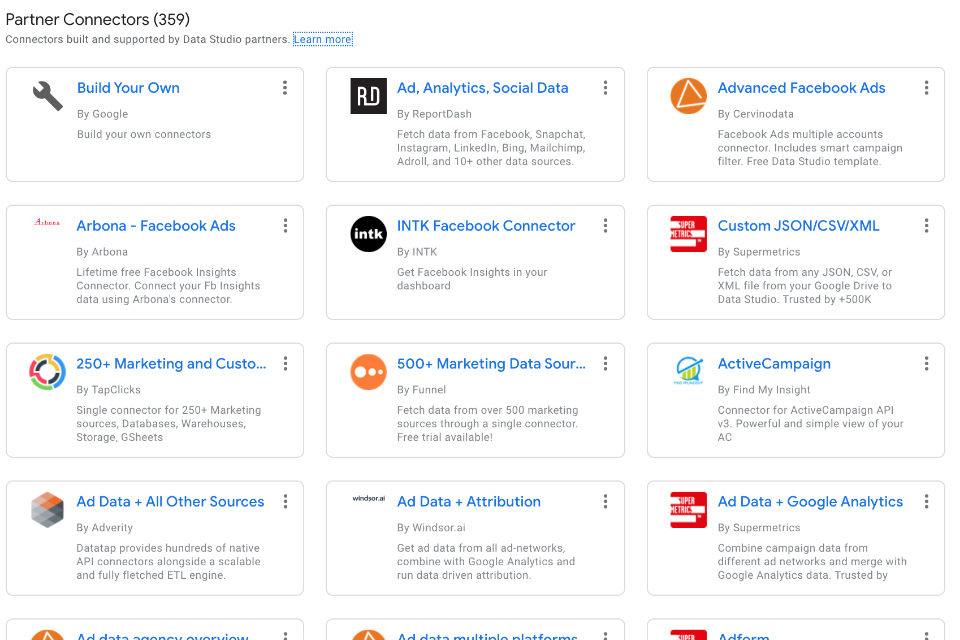
You need Connectors, and it's not free
Contrary to what some believe, Data Studio is not free, because you more often than not need connectors. Connectors is what you use to source the data. All the Google tools have free connectors, but Facebook ads for example, does not.
In comes Supermetrics, the most famous connector, that can pull your data from the Facebook, Instagram, Linkedin, Mailchimp,... API's and provide them to Data Studio.

Supermetrics vs Reportdash connector
Supermetrics is an expensive tool, and in my search for alternatives, I found ReportDash. This young tool does what supermetrics does, for 1/3rd of the price. But it also does more. It's actually a visualization tool (like Data Studio) in itself.
It must be said, it's younger and in terms of speed, it's slower than Supermetrics. But in the end, I've managed to set it up in a stable way.
02.-
Complexities
Every project has its complexities
The sum of various ad spends
After fetching the ad spend of Adwords, Linkedin & Facebook, we needed the sum of all 3, per day, week & month. Data Studio is not ideal: to create a mixed dataset, your datasets need to be almost identical and you don't have a lot of freedom to manipulate the data. Above that, error messages are not very clear.
When using supermetrics, a solution can be to use supermetrics for Sheets, save the data there, make calculations and use the sheet with calculated data as a source in Data Studio.
With ReportDash, you can easily create datasets and calculations within their tool! Just be careful not to make these derived datasets too complex or it will drastically slow down your final report.

Goals (conversions) were not set in G.A.
Our client wanted conversions for their free course as well as the paid course. The problem was that these were not set as Goals in Google Analytics, and the campaign had already started.
I discovered I could create different segments in Google Analytics (they do work retro-actively, compared to goals!). These segments make a difference between sessions in which a user visited the free or paid course thank you page.
And, I could use these saved segments within data studios!
03.-
Delivery
The birdhouse team can visit its' dashboard to keep track of their campaign. They also receive a daily email, which is super easy to set up with Data Studio.


